Note
Go to the end to download the full example code.
Run GroupLasso and GroupLasso CV for structured sparse recovery
The example runs the GroupLasso scikit-learn like estimators.
import numpy as np
import matplotlib.pyplot as plt

from celer import GroupLassoCV, LassoCV
from celer.datasets import make_correlated_data

print(__doc__)

# Generating X, y, and true regression coefs with 4 groups of 5 non-zero values

n_samples, n_features = 100, 50

w_true = np.zeros(n_features)
w_true[:5] = 1
w_true[10:15] = 1
w_true[30:35] = -1
w_true[45:] = 1
X, y, w_true = make_correlated_data(
    n_samples, n_features, w_true=w_true, snr=5, random_state=0)
Get group Lasso’s optimal alpha for prediction by cross validation
groups = 5  # groups are contiguous and of size 5
# irregular groups are also supported,
group_lasso = GroupLassoCV(groups=groups)
group_lasso.fit(X, y)

print("Estimated regularization parameter alpha: %s" % group_lasso.alpha_)

fig = plt.figure(figsize=(6, 3), constrained_layout=True)
plt.semilogx(group_lasso.alphas_, group_lasso.mse_path_, ':')
plt.semilogx(group_lasso.alphas_, group_lasso.mse_path_.mean(axis=-1), 'k',
             label='Average across the folds', linewidth=2)
plt.axvline(group_lasso.alpha_, linestyle='--', color='k',
            label='alpha: CV estimate')

plt.legend()

plt.xlabel(r'$\alpha$')
plt.ylabel('Mean square prediction error')
plt.show(block=False)


lasso = LassoCV().fit(X, y)
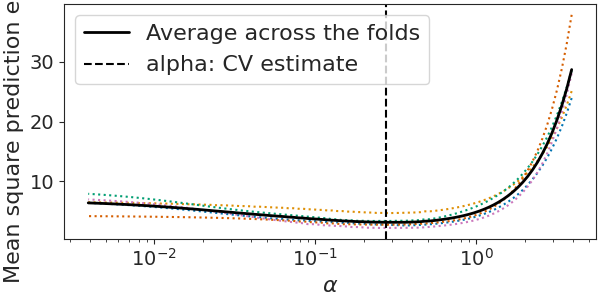
Estimated regularization parameter alpha: 0.2750549815570016
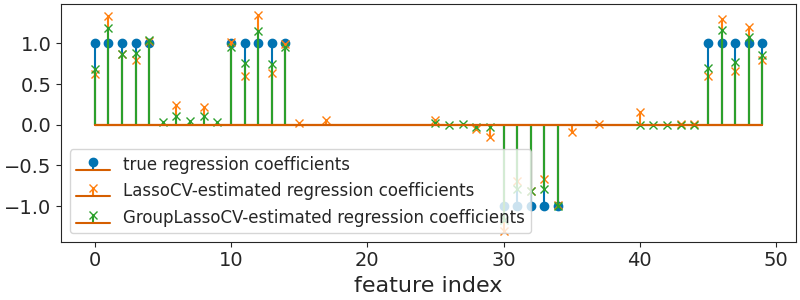
Show optimal regression vector for prediction, obtained by cross validation
fig = plt.figure(figsize=(8, 3), constrained_layout=True)
m, s, _ = plt.stem(np.where(w_true)[0], w_true[w_true != 0],
                   label=r"true regression coefficients")
labels = ["LassoCV-estimated regression coefficients",
          "GroupLassoCV-estimated regression coefficients"]
colors = [u'#ff7f0e', u'#2ca02c']

for w, label, color in zip([lasso.coef_, group_lasso.coef_], labels, colors):
    m, s, _ = plt.stem(np.where(w)[0], w[w != 0], label=label, markerfmt='x')
    plt.setp([m, s], color=color)
plt.xlabel("feature index")
plt.legend(fontsize=12)
plt.show(block=False)
Total running time of the script: (0 minutes 0.812 seconds)