Note
Go to the end to download the full example code.
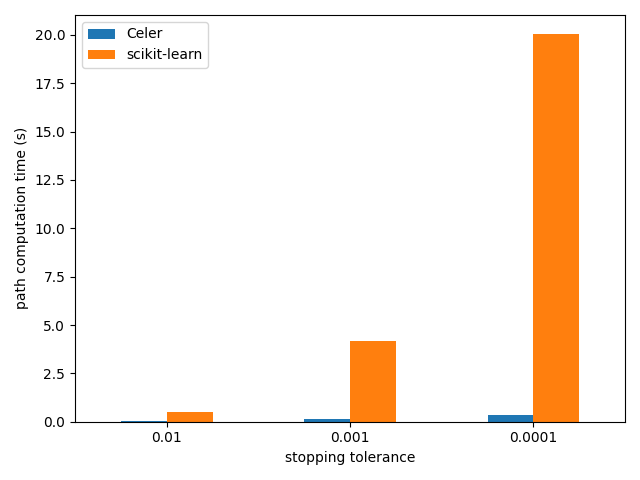
Lasso path computation on Leukemia dataset
The example runs the Celer algorithm for the Lasso on the Leukemia dataset which is a dense dataset.
Running time is compared with the scikit-learn implementation.
Loading data...
/home/circleci/.local/lib/python3.8/site-packages/sklearn/datasets/_openml.py:311: UserWarning: Multiple active versions of the dataset matching the name leukemia exist. Versions may be fundamentally different, returning version 1.
  warn(
/home/circleci/.local/lib/python3.8/site-packages/sklearn/datasets/_openml.py:1022: FutureWarning: The default value of `parser` will change from `'liac-arff'` to `'auto'` in 1.4. You can set `parser='auto'` to silence this warning. Therefore, an `ImportError` will be raised from 1.4 if the dataset is dense and pandas is not installed. Note that the pandas parser may return different data types. See the Notes Section in fetch_openml's API doc for details.
  warn(
Starting path computation...
Celer time: 0.03 s
Celer time: 0.13 s
Celer time: 0.35 s
import time
import pandas as pd
import numpy as np
import matplotlib.pyplot as plt

from sklearn.linear_model import lasso_path
from sklearn.datasets import fetch_openml

from celer import celer_path

print(__doc__)

print("Loading data...")
dataset = fetch_openml("leukemia")
X = np.asfortranarray(dataset.data.astype(float))
y = 2 * ((dataset.target != "AML") - 0.5)
n_samples = len(y)

y -= np.mean(y)
y /= np.std(y)

print("Starting path computation...")
alpha_max = np.max(np.abs(X.T.dot(y))) / n_samples

n_alphas = 100
alphas = alpha_max * np.geomspace(1, 0.01, n_alphas)

tols = [1e-2, 1e-3, 1e-4]
results = np.zeros([2, len(tols)])
for tol_ix, tol in enumerate(tols):
    t0 = time.time()
    _, coefs, gaps = celer_path(
        X, y, pb='lasso', alphas=alphas, tol=tol, prune=True)
    results[0, tol_ix] = time.time() - t0
    print('Celer time: %.2f s' % results[0, tol_ix])

    t0 = time.time()
    _, coefs, dual_gaps = lasso_path(
        X, y, tol=tol, alphas=alphas, max_iter=10_000)
    results[1, tol_ix] = time.time() - t0

df = pd.DataFrame(results.T, columns=["Celer", "scikit-learn"])
df.index = [str(tol) for tol in tols]
df.plot.bar(rot=0)
plt.xlabel("stopping tolerance")
plt.ylabel("path computation time (s)")
plt.tight_layout()
plt.show()
Total running time of the script: (1 minutes 36.131 seconds)